
GBP/JPY Price Forecast: Testing range top at 210.20 amid broad Pound strength
- GBP/JPY consolidates around 210.00, just below the top of the recent range, at 210.20.
- UK government's pledge for fiscal responsibility and the upward revision of the UK's GDP growth have provided a fresh boost to the Pound.
- BoJ officials are leaning against back-to-back interest rate hikes.
The British Pound (GBP) is trading flat, just below the top of the last three weeks' trading range against the Japanese Yen (JPY) on Wednesday, buoyed by the UK government's pledge of fiscal responsibility. The GBP/JPY pair changes hands at 210.00 at the time of writing, with bulls aiming to break a resistance area around 210.20, which has capped rallies several times in the last few weeks.
A report by the Financial Times newspaper highlights that the UK Chancellor, Jon Healey, plans to finance the new measures in the budget with spending cuts or higher taxes instead of additional debt. Before that, the International Monetary Fund (IMF) revised the UK’s 2026 growth prospects to 1.3% from the previous 1% and stated that the government does not need to accelerate the pace of fiscal consolidation, which provided a fresh impulse to the Sterling.
The Japanese Yen, by contrast, remains on the back foot after softer-than-expected Japanese Producer Price Index (PPI) figures on Monday, and comments from Bank of Japan (BoJ) officials pointing to steady monetary policy at October’s meeting. BoJ Governor Kazuho Ueda reiterated the importance of keeping inflation anchored near the 2% target, but he did not mention any timing for a further monetary tightening move.
Technical analysis: Trading above the top of a triangle pattern
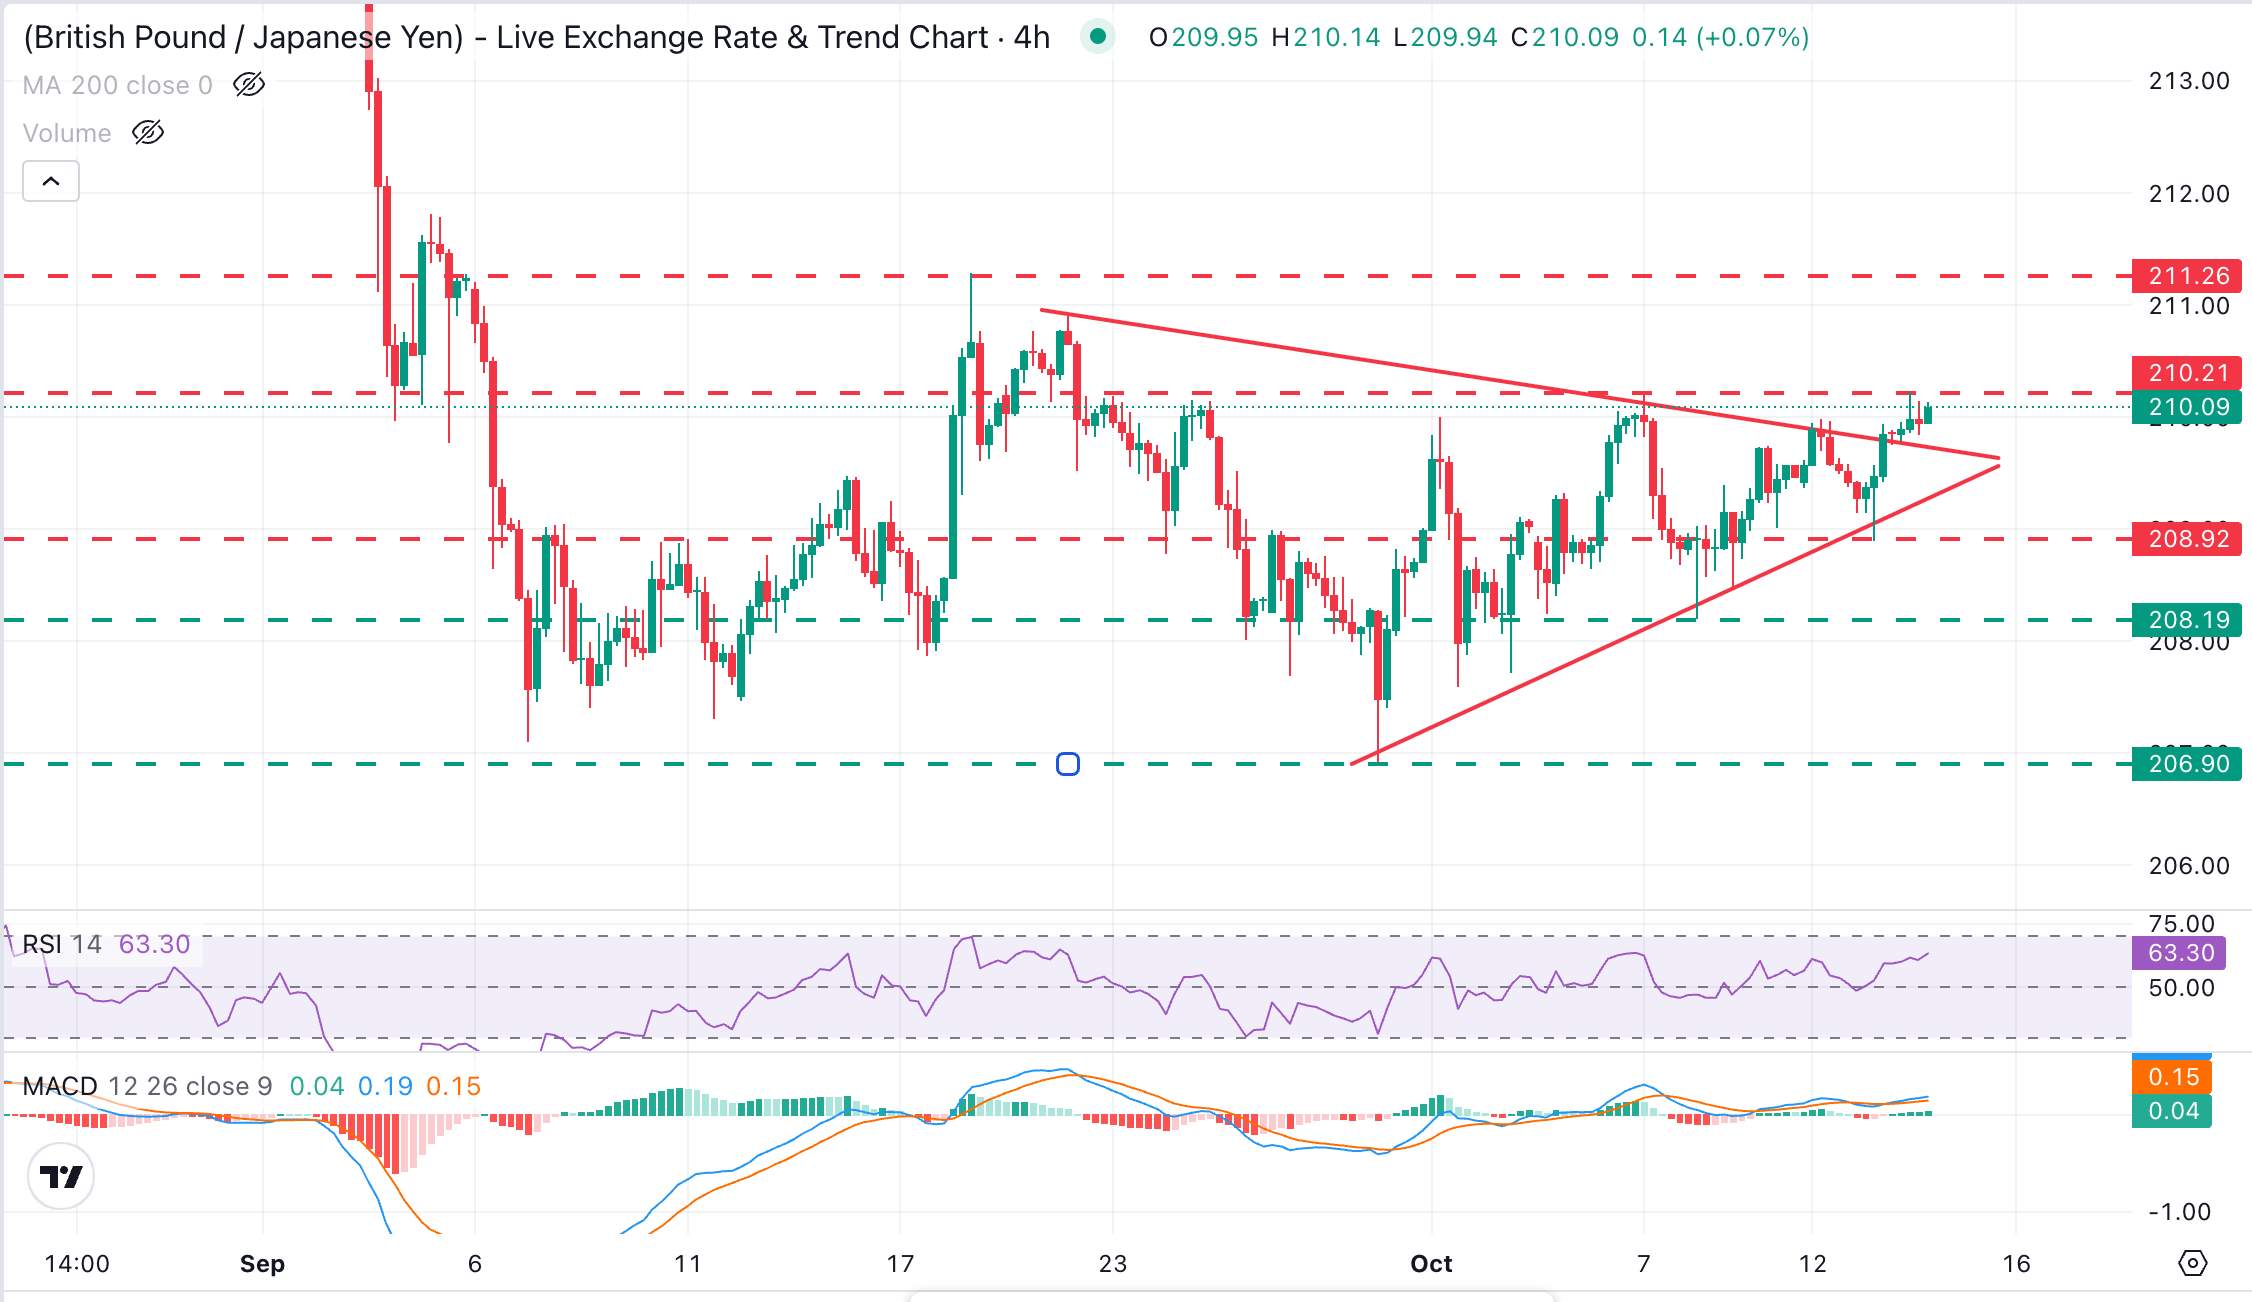
GBP/JPY bulls have pierced the top of a triangle pattern and are targeting the resistance area around 210.20 to confirm the bullish breakout. Momentum indicators in 4-hour charts reinforce that view, as the Relative Strength Index (14) crossed above the 60 level with the Moving Average Convergence Divergence (MACD) slightly positive, hinting that bullish momentum is building.
A clear break of the 210.20 area (September 23 and 24 and October 7 highs) will expose the area between the September 18 high, at 211.28, and the September 4 high, at the 211.80 area.
On the downside, immediate support is at Tuesday's low of 208.90, where the triangle bottom lies, ahead of the October 5 and 8 lows near the 208.20 area and the late September lows at 206.90.
(The technical analysis of this story was written with the help of an AI tool. Know more.)
Pound Sterling Price Today
The table below shows the percentage change of British Pound (GBP) against listed major currencies today. British Pound was the strongest against the Swiss Franc.
| USD | EUR | GBP | JPY | CAD | AUD | NZD | CHF | |
|---|---|---|---|---|---|---|---|---|
| USD | -0.01% | -0.03% | 0.05% | -0.01% | -0.36% | -0.14% | 0.08% | |
| EUR | 0.00% | -0.03% | 0.07% | 0.00% | -0.37% | -0.16% | 0.08% | |
| GBP | 0.03% | 0.03% | 0.08% | -0.00% | -0.33% | -0.13% | 0.11% | |
| JPY | -0.05% | -0.07% | -0.08% | -0.05% | -0.42% | -0.19% | 0.04% | |
| CAD | 0.01% | -0.00% | 0.00% | 0.05% | -0.35% | -0.15% | 0.08% | |
| AUD | 0.36% | 0.37% | 0.33% | 0.42% | 0.35% | 0.22% | 0.43% | |
| NZD | 0.14% | 0.16% | 0.13% | 0.19% | 0.15% | -0.22% | 0.23% | |
| CHF | -0.08% | -0.08% | -0.11% | -0.04% | -0.08% | -0.43% | -0.23% |
The heat map shows percentage changes of major currencies against each other. The base currency is picked from the left column, while the quote currency is picked from the top row. For example, if you pick the British Pound from the left column and move along the horizontal line to the US Dollar, the percentage change displayed in the box will represent GBP (base)/USD (quote).