
USD/JPY Price Forecast: Hammer signals rebound risk near 156.00
- USD/JPY forms hammer candle near support, hinting at potential recovery.
- Bearish RSI below neutral keeps sellers favored despite reversal signals.
- Break below 156.08 exposes 155.00, while 157.57 caps recovery attempts.
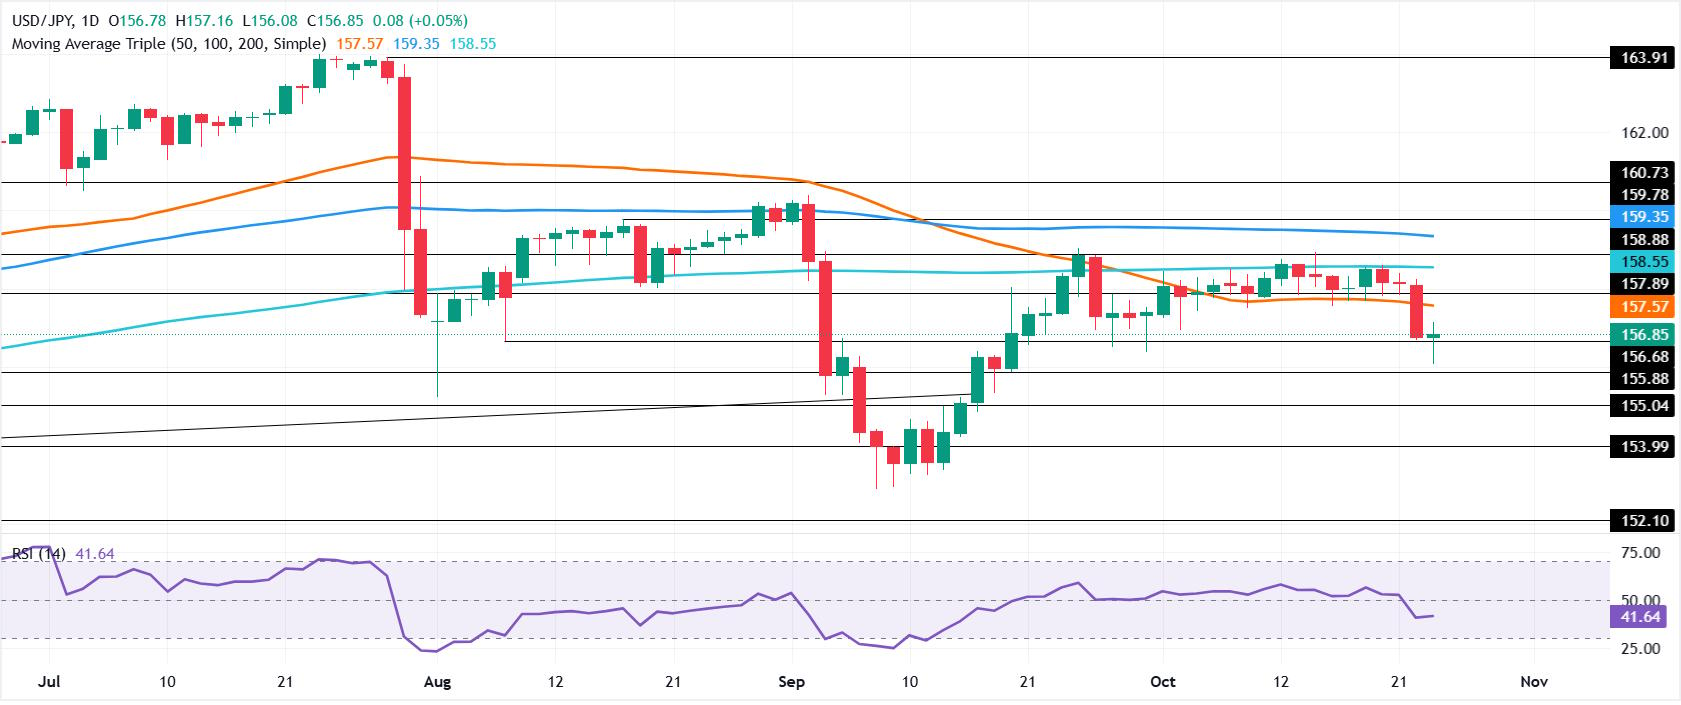
The Japanese Yen finished the week on a higher note as the USD/JPY pair registered losses of over 0.74% in the week, while holding firm daily amid a sour market mood. The pair trades at 156.85 as a ‘hammer candle pattern’ forms.
USD/JPY Price Forecast: Technical outlook
Price action is consistent for further sideways action, with the USD/JPY trapped within the 156.00-159.00, 300-pip range, with neither buyers nor sellers able to decisively clear immediate support and resistance levels, delineated by the range.
Momentum shifted bearish, with the 14-day Relative Strength Index (RSI) edging below its 50-neutral level, indicating that sellers are strengthening.
Therefore, the path of least resistance is downwards. The first support is the 156.50 psychological level. Beneath lies the October 23 daily low of 156.08 before sellers aim towards the 155.00 milestone. A breach of the latter will expose the September 8 swing low of 152.89.
Upward, the first USD/JPY resistance is the 50-day Simple Moving Average (SMA) at 157.57. On further strength, the next stop is the 100-day SMA at 158.50, followed by the 200-day SMA at 159.35.
USD/JPY Price Chart – Daily
Japanese Yen Price This week
The table below shows the percentage change of Japanese Yen (JPY) against listed major currencies this week. Japanese Yen was the strongest against the US Dollar.
| USD | EUR | GBP | JPY | CAD | AUD | NZD | CHF | |
|---|---|---|---|---|---|---|---|---|
| USD | -0.15% | -0.46% | -0.77% | -0.81% | -1.12% | -0.74% | -0.14% | |
| EUR | 0.15% | -0.31% | -0.56% | -0.61% | -0.88% | -0.58% | 0.03% | |
| GBP | 0.46% | 0.31% | -0.25% | -0.30% | -0.56% | -0.26% | 0.41% | |
| JPY | 0.77% | 0.56% | 0.25% | -0.05% | -0.35% | 0.02% | 0.75% | |
| CAD | 0.81% | 0.61% | 0.30% | 0.05% | -0.29% | 0.09% | 0.71% | |
| AUD | 1.12% | 0.88% | 0.56% | 0.35% | 0.29% | 0.30% | 0.94% | |
| NZD | 0.74% | 0.58% | 0.26% | -0.02% | -0.09% | -0.30% | 0.66% | |
| CHF | 0.14% | -0.03% | -0.41% | -0.75% | -0.71% | -0.94% | -0.66% |
The heat map shows percentage changes of major currencies against each other. The base currency is picked from the left column, while the quote currency is picked from the top row. For example, if you pick the Japanese Yen from the left column and move along the horizontal line to the US Dollar, the percentage change displayed in the box will represent JPY (base)/USD (quote).